

 Mikayla Martinsen
Double Your Dollars with GTR This July!
Summer is here, and at GTR, we’re turning up the heat on your referral rewards.
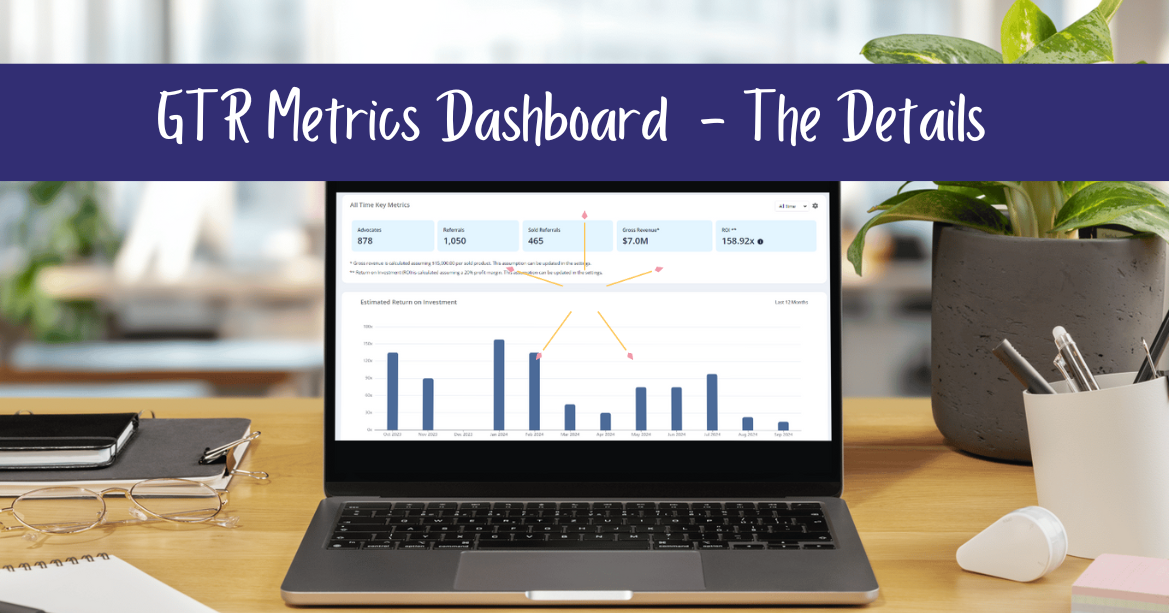

New Feature Release: New GTR Metrics Dashboard
Launch Date: Monday, Oct 28th at 12:00 PM PDT
Expected downtime: None
Available to: All Companies
The landing page of the dashboard has been completely redesigned with a new, modern look, key company metrics, and all new graphs and charts to see your company's usage Revenue and Return on Investment (ROI) estimates at a glance.
* Advocate Count
* Referral Count
* Sold Referral Count
* Estimated Gross Revenue
* Estimated Return on Investment
* Estimated Return on Investment
* New Advocates, Referrals, and Sold Referrals over time
* Sales Velocity
* Estimated Gross Revenue
* Estimated Total Gross Revenue
* Breakdown of current Referrals by Status
* Sales Rep Leaderboard
* Filter certain data by preset time periods.
* Customizable average sale and profit margin values for Gross Revenue and ROI calculations.
* Exportable, searchable, and interactive Sales Rep Leaderboard.
* The old dashboard is still available for now and can be toggled back to with the click of a button.
* Role-specific data scoping: - Sales reps see the data for their advocates and referrals submitted by their advocates; the Company admin sees aggregated data for the whole company.
See the company's overall performance and a glance.
* Advocate Registrations.
* Referral Submissions
* Converted Referrals
* Gross Revenue
* Return on Investment (ROI).
Filter metrics down to preset time periods:
* All time
* Last 12 months
* Last 6 months
* Last 90 days
- Gross revenue and ROI are calculated based on the Average Sale and Profit Margin configured in your settings.
- Referral rewards should be factored into the Average Sale or Profit Margin values.
- GTR subscription costs are already factored into the ROI calculation.
- The ROI metric is not available for Sales Rep users.

- Instantly identify the value Get The Referral brings to your company over time.
- Calculated as the estimated gross revenue divided by GTR Subscription cost for the month.
- Not available to Sales Rep users.

View the number of New Advocates, Submitted Referrals, and Sold or Converted Referrals recorded over time for the last 12 months.

View the breakdown of referral status for all referrals submitted in the last 12 months.

* Track the average amount of time it takes for a referral to convert to a sale.
* Bars are grouped by the month that the lead was sold or converted.

* Identify the dollar value brought in by referrals each month.
* Calculated as the number of sold or converted referrals times the average sale.
* Hover over a month for a more precise Estimated Gross Revenue value.

* Watch revenues grow with the cumulative Gross Revenue for each month.
* Hovering over a single month for a more precise value.

* View and compare the total number of Sales Reps and Sold Referrals recorded over the past 12 months.
* Not available for Sales Rep users.

This table shows a complete list of Sales Reps, along with the total number of Advocates, Referrals, Sold Referrals, Close Ratios, and Estimated Revenue over a selected period. By default, the table is sorted by Sold Referrals, but Company Admins can filter by other columns.
The leaderboard can be filtered down to preset time periods:
* All time
* Last 30 Days
* Month to Date
* Last 12 Months
* Year to Date
- All data in the leaderboard can be exported for external use and record keeping.
- Not available to Sales Rep users.

The "Where did it go?" section includes a new entry explaining the Dashboard Switcher functionality, which allows Company Admins to switch between the classic and updated versions of the dashboard.

Getting Started with Your New GTR Metrics Dashboard
The GTR Metrics Dashboard isn’t just another tool—it’s your partner in driving exceptional results and gaining valuable insights. Discover its power today and stay a step ahead with data that makes a difference.
If you’re already part of the GTR family, the Metrics Dashboard is ready and waiting! Simply log in to your account to explore it now. And remember, our support team is always here to ensure a smooth experience.
New to GTR and curious about what the Metrics Dashboard can do for you? Book a demo below, and let us show you how referral insights can elevate your business!


Summer is here, and at GTR, we’re turning up the heat on your referral rewards.

Faster Onboarding, Smoother Experience: Meet Our New Complete Registration Flow

Running a home services business means every message you send matters. Whether it’s a referral invite, a project update, or an appointment reminder...
.webp)
2 min read
How MHI Roofing Boosted Sales and Streamlined Referrals with GTR Running a roofing business means you’re constantly finding ways to improve...
1 min read
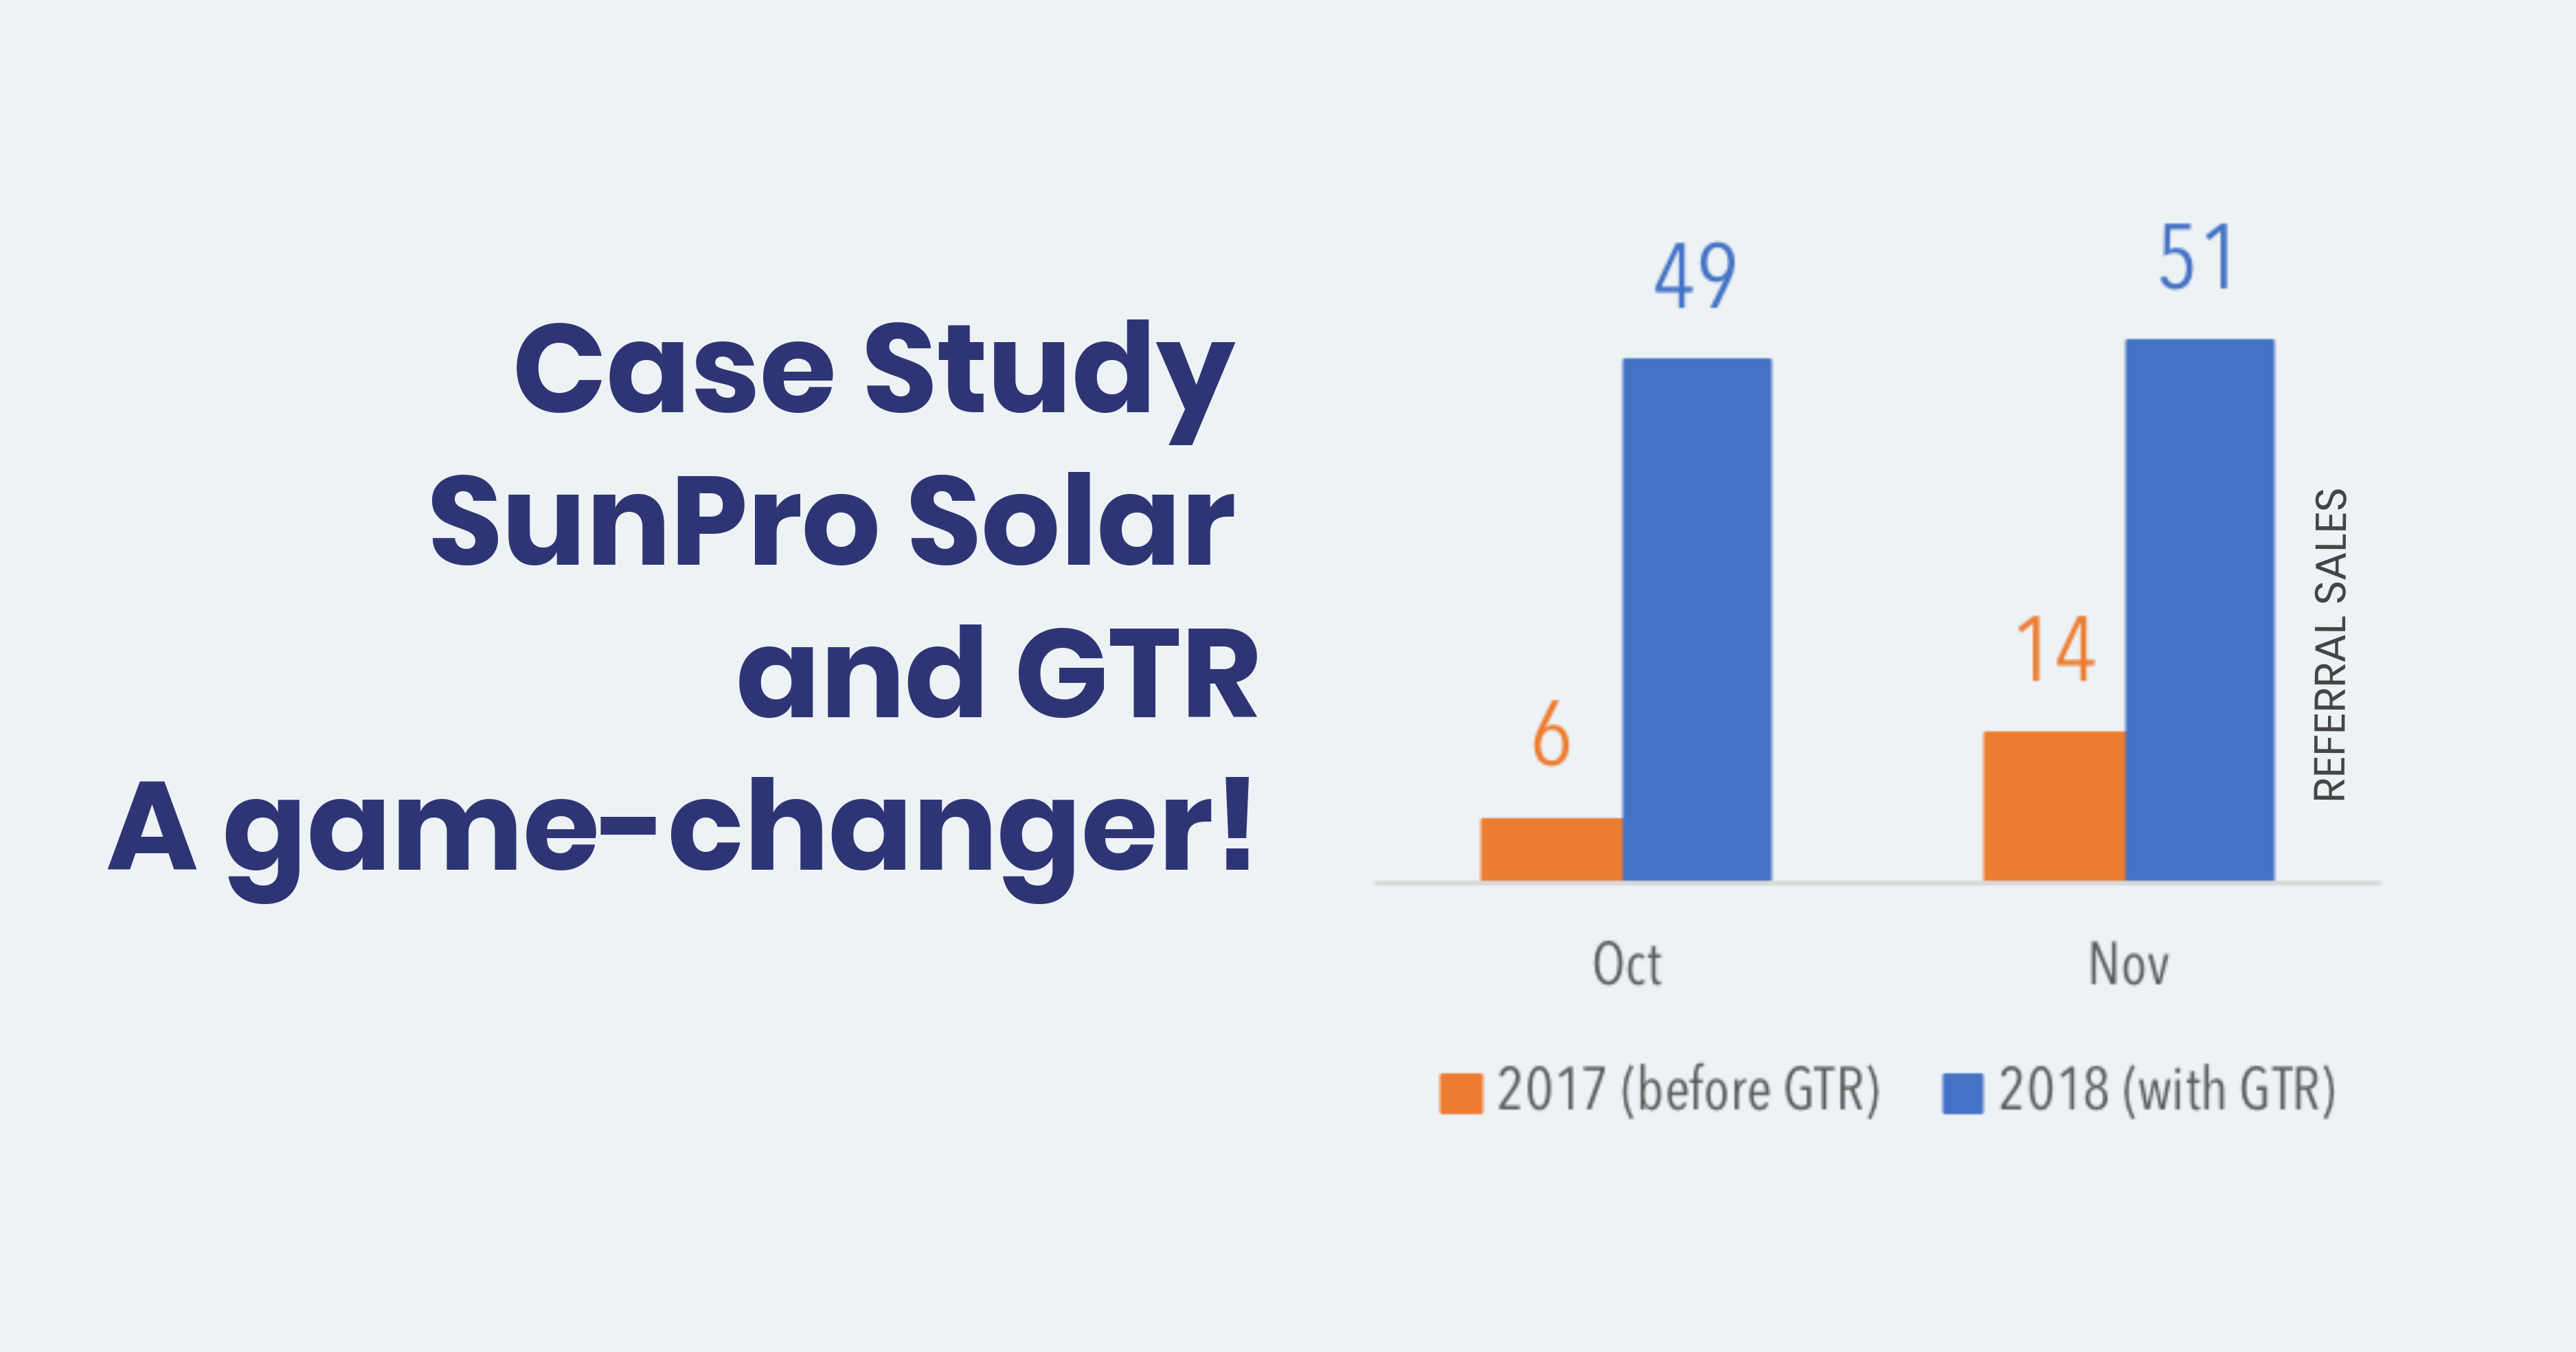
SunPro Solar has been working with GTR for almost a year and is seeing great results. They increased their referral closing ratio approximately 7x...
.webp)
1 min read
MR ROOFING and GTR: "Millennials are now buying homes or replacing roofs, and they are used to (using) technology." MR Roofing, a roofing and solar...